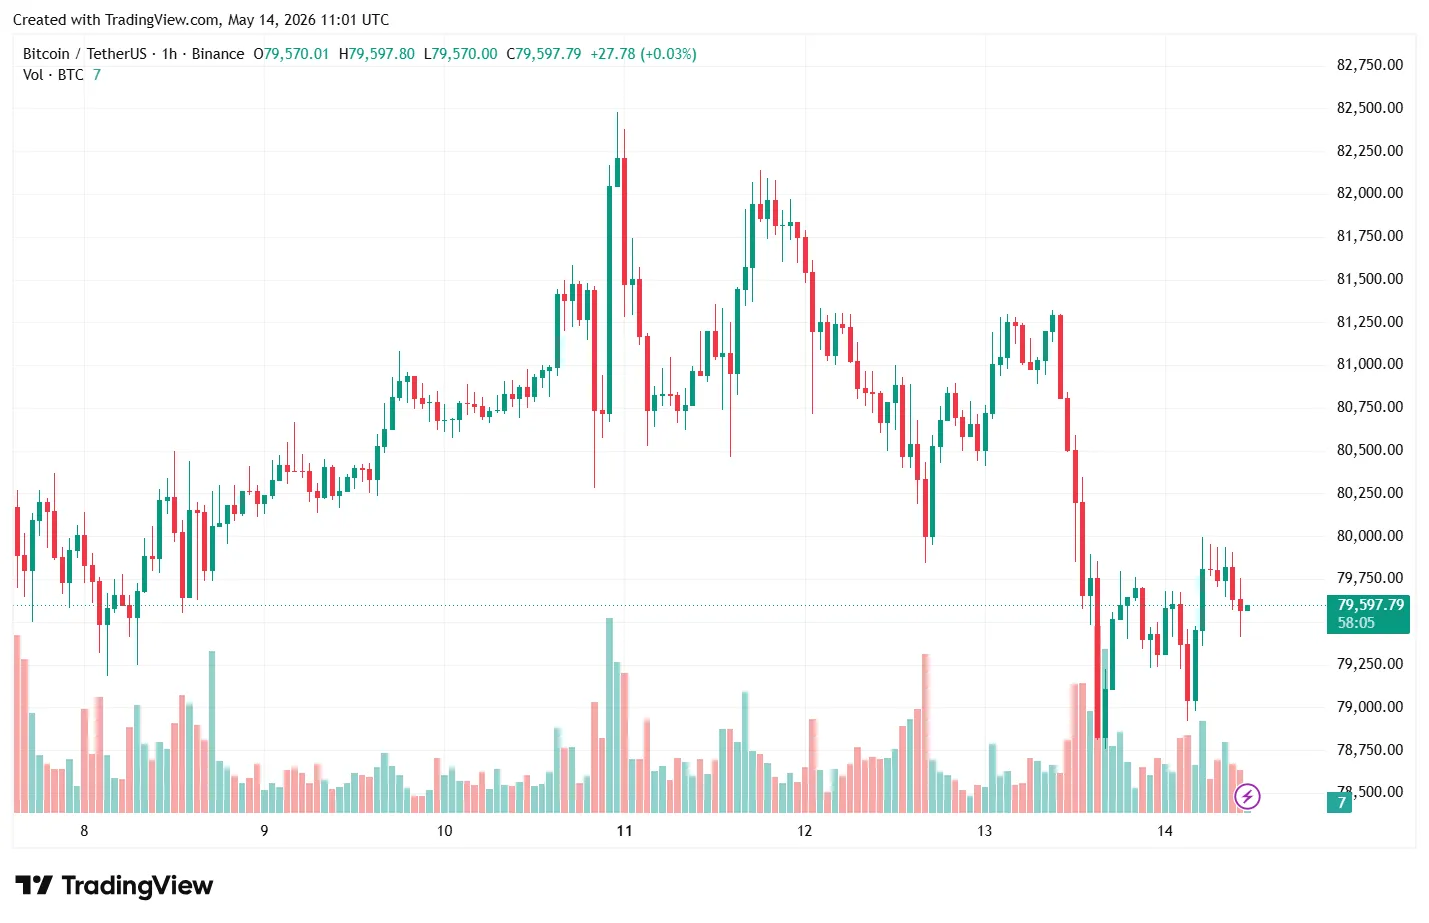
The cryptocurrency market has faced a major trial. On May 13, the leading digital asset’s price slipped below the psychological $80,000 mark. The primary catalyst for this drop was US macroeconomic data, which forced investors to rethink the immediate future of risk assets.
The Inflation Shock and the Fed’s Stance
The main trigger for the correction was the release of the April Producer Price Index (PPI). The indicator rose by 1%, hitting its highest level since March 2022.
- Core Inflation: Reached 5.2% (exceeding the 4.3% forecast).
- Fed Interest Rates: The market has now priced in a 30% probability of a rate hike before the end of the year, dashing hopes for a near-term pivot to “dovish” monetary policy.
- Bond Yields: A rise in 10-year Treasury yields to 4.46% added further pressure to the crypto market.
Matt Mena, an analyst at 21Shares, warns that if Bitcoin fails to reclaim $80,000, the next targets for the bears will be the $78,000 and $75,000 zones.
ETFs and Institutions: Cashing Out
The price drop was accompanied by record outflows from spot ETFs. Over two days (May 12 and 14), a total of over $860 million was withdrawn from Bitcoin funds. The Ethereum ETF sector also recorded a net outflow of approximately $167 million.
Key Observation: Unlike the panic seen in February, the current selling is occurring against the backdrop of a relatively “strong” market. Bitfinex experts note that institutional players are using current prices for deliberate profit-taking rather than fleeing the market in fear.
Technical Analysis and the “Domino Effect”
According to analyst Easy On Chain, a combination of factors led to the crash:
- Buyer Shortage: By May 11, the volume of BTC withdrawals from exchanges fell to 19,995 BTC (compared to the usual 25,000–35,000 BTC). This created a liquidity surplus.
- Liquidations: The sharp price drop triggered the forced closure of long positions. On May 12 alone, the volume of long liquidations was 11 times higher than short-seller losses.
- Deleveraging: Open interest in futures fell by 7% (to $36.8 billion), indicating that margin traders are exiting the market.
Positive Signals: Whales are Still in the Game
Despite the correction, Glassnode data indicates that fundamental interest remains. After the dip to $60,000 and the subsequent recovery to $80,000, inflows into US ETFs have stabilized.
| Key Level | Value | Description |
| Support | $76,900 | Average purchase price for short-term investors. |
| Resistance | $86,900 | Volume concentration zone accumulated over recent months. |
The current net capital inflow into the network stands at $2.8 billion per month. While this is a positive sign, it remains well below the peaks of 2023-2025 (over $10 billion).
Summary
The market structure is gradually improving, and volatility is decreasing. However, to spark a new sustained rally, Bitcoin needs to see exchange net flows return to negative territory and break through the resistance in the $82,000 – $85,200 range, where a large number of options are concentrated.
The market has shifted from a phase of “fear” to one of “uncertainty.” If the $60,000 floor holds, this current cycle could go down in history as the period with the asset’s “shallowest” drawdown.