Demand growth for the leading cryptocurrency has slowed, which may indicate a shift toward a bear market. This is the conclusion reached by analysts at CryptoQuant.
According to their outlook, a market bottom could form near the realized price—around $56,000. In that scenario, the drawdown from the all-time high would reach 55%. An intermediate support level is seen at $70,000.
The analysts noted that since 2023 the industry has experienced three major waves of activity, driven by the launch of U.S. spot ETFs, the outcome of U.S. elections, and the expansion of corporate treasuries.
Since early October 2025, demand indicators have fallen below their trend levels. In the experts’ view, most of the buying in the current cycle has already taken place, removing a key layer of price support.
Institutions Turn to Selling
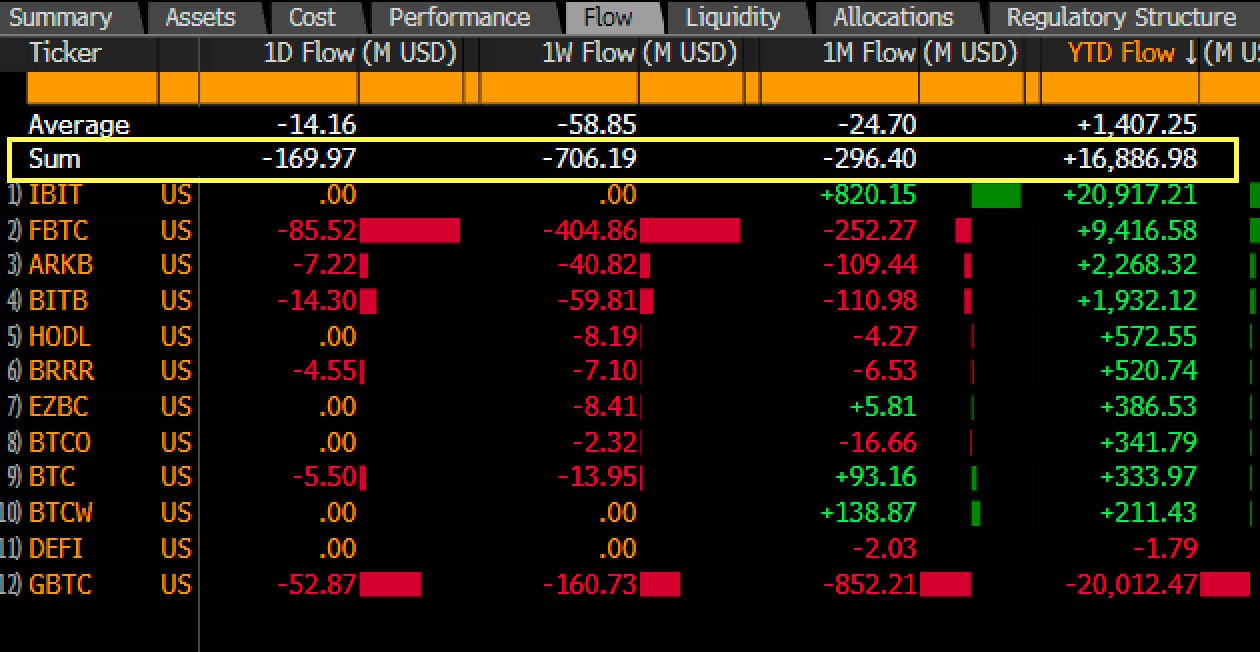
Institutional investors have started reducing exposure. In Q4 2025, U.S. spot Bitcoin ETFs became net sellers, offloading 24,000 BTC. This contrasts with the aggressive accumulation seen in late 2024.
Addresses holding between 100 and 1,000 BTC are also showing performance below trend. A similar pattern appeared in late 2021 ahead of the previous “crypto winter.”
Derivatives Signal Lower Risk Appetite
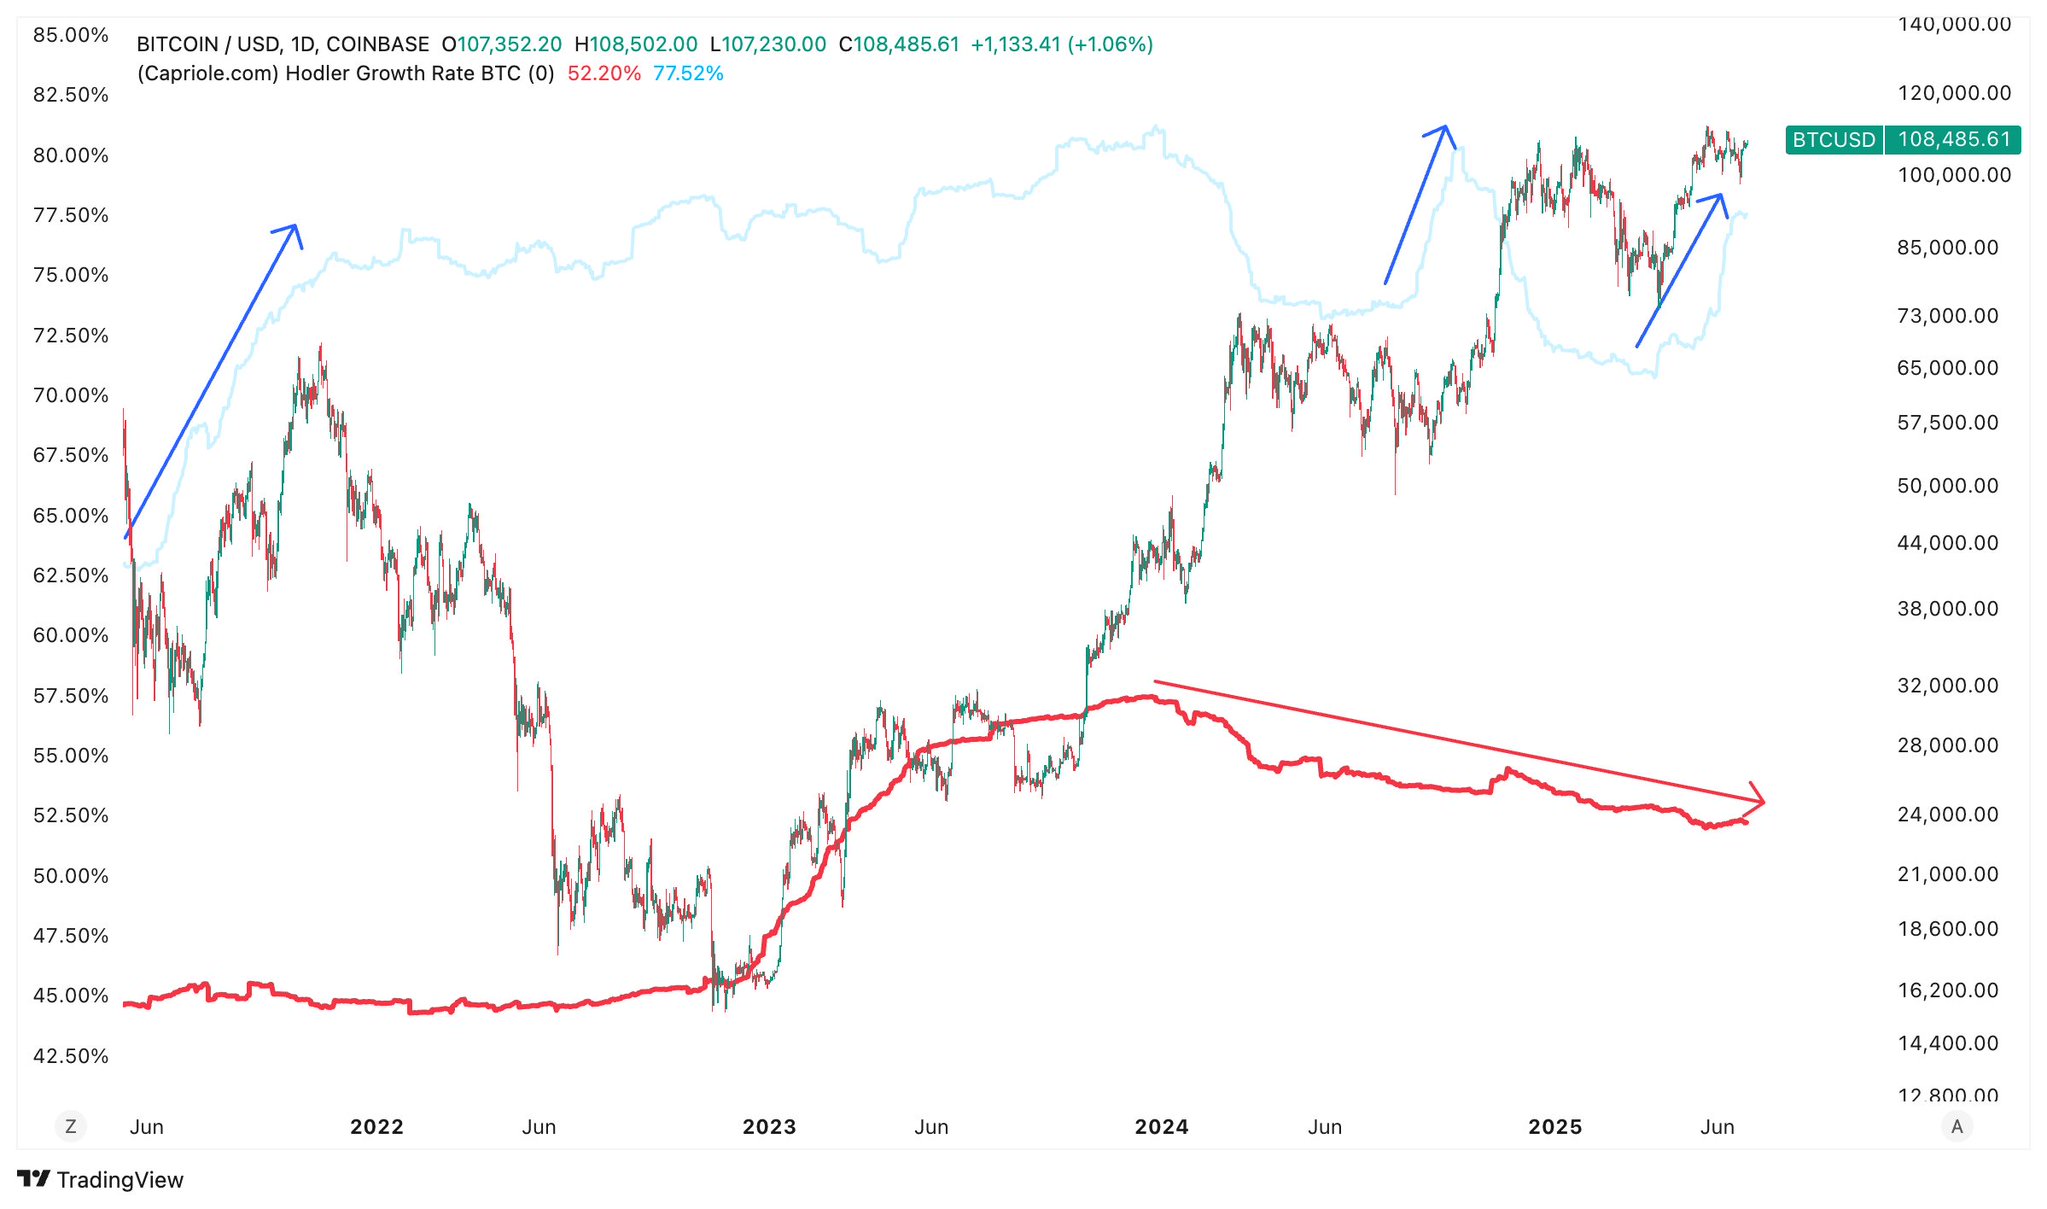
Derivatives markets further confirm weakening risk appetite. Funding rates have dropped to their lowest levels since December 2023. Bitcoin’s price has also fallen below the 365-day moving average—a level that historically separates bullish and bearish phases.
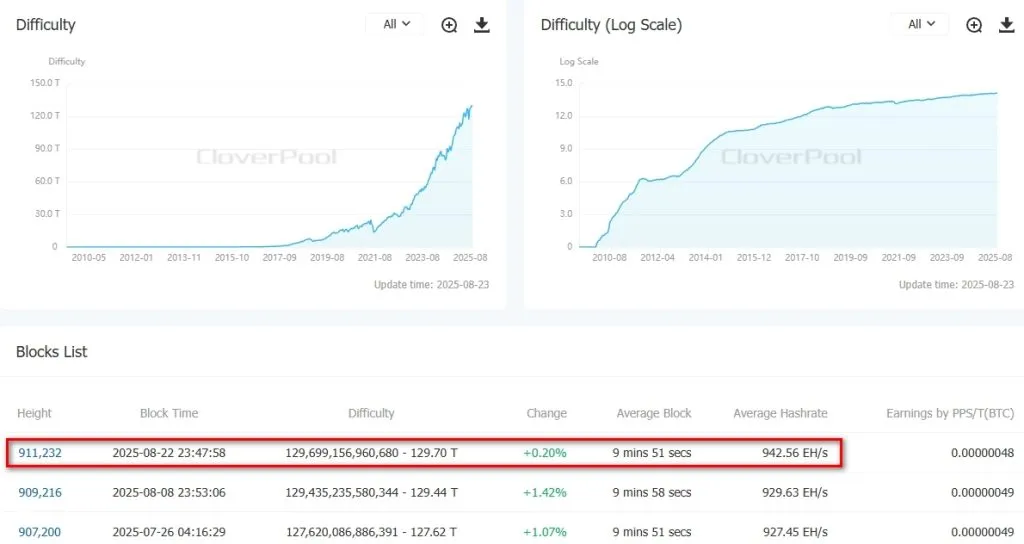
CryptoQuant emphasized that Bitcoin’s four-year cycles depend on the expansion and contraction of demand rather than the halving itself.
Opinion: The Bitcoin Network Is “Cooling Off”
CryptoQuant analyst GugaOnChain argues that Bitcoin has entered a bear phase. He points to technical indicators and declining on-chain activity as evidence.
The expert noted that the 30-day moving average has fallen below the 365-day moving average by 0.52%. The downtrend is also supported by the Bull-Bear indicator.
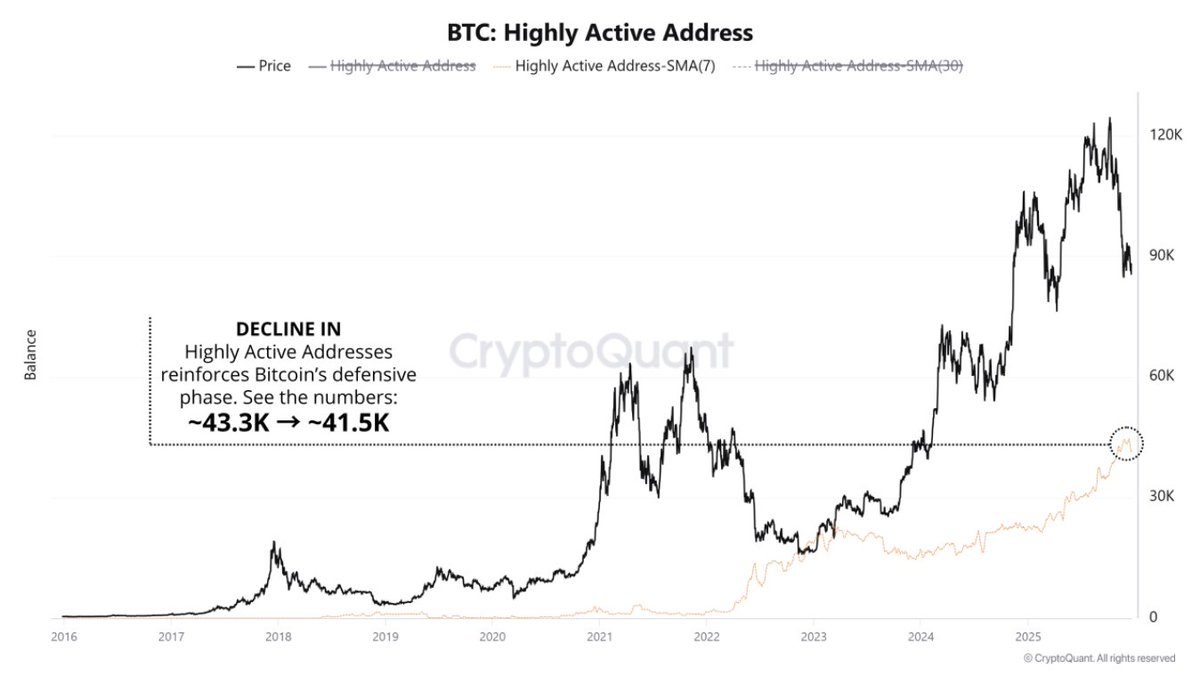
A steady decline in active addresses suggests speculators are leaving and trading interest is fading.
The slowdown is visible in 7-day moving averages of key metrics:
- Transactions: down from ~460,000 to ~438,000
- Fees: total volume decreased from ~$233,000 to ~$230,000
- Highly active addresses: down from 43,300 to 41,500
In this environment, institutions and other large players appear to be shifting into a more defensive stance and focusing on accumulation.
Comparing current data to 2018, GugaOnChain found similar patterns: falling transaction activity, low fees, and whales stepping back.
The difference is the size of the user base: around 800,000 active participants now versus 600,000 in the previous cycle—suggesting a more mature network. He concluded that this kind of lull often precedes a spike in volatility.