The quotes of the flagship cryptocurrency have encountered strong resistance around $80,000. Consolidating higher is hindered by a wave of profit-taking by investors, while prices are supported by steady inflows into spot ETFs and a shifting macroeconomic climate.
The Anatomy of Consolidation: Who is Selling and Who is Buying?
According to XWIN Japan analysts, almost all categories of market participants are once again in the zone of solid profit. This creates natural selling pressure at key psychological levels.
The unrealized profit indicator across investor cohorts shows the following values:
- 21.1 — Long-term holders
- 13.9 — Capital aged up to 1 month
- 13.4 — Short-term holders
- 5.3 — New investors
The dynamics of the SOPR (Spent Output Profit Ratio) also confirm a shift in the behavioral models of market participants. As the price approached $80,000, the metric jumped to approximately 1.4. This is a clear signal of active selling by long-term investors. However, the subsequent pullback of the indicator to 0.93 indicates that the initiative for profit realization has shifted to short-term participants.
“This indicates a healthier market, but it also means that a significantly larger number of holders now have the opportunity to lock in profits, slowing down the growth,” the experts noted.
The Transition Phase and Derivatives Market Signals
Popular on-chain analyst GugaOnChain draws attention to the Delta-Thermo Market Multiple (DTMM) index, which stood at 2.03 with Bitcoin’s price around $78,000. This is a classic “transitional macro zone”: the asset has finally left the accumulation phase (1.5x) but has not yet gathered enough momentum to enter the parabolic expansion phase (2.5x).
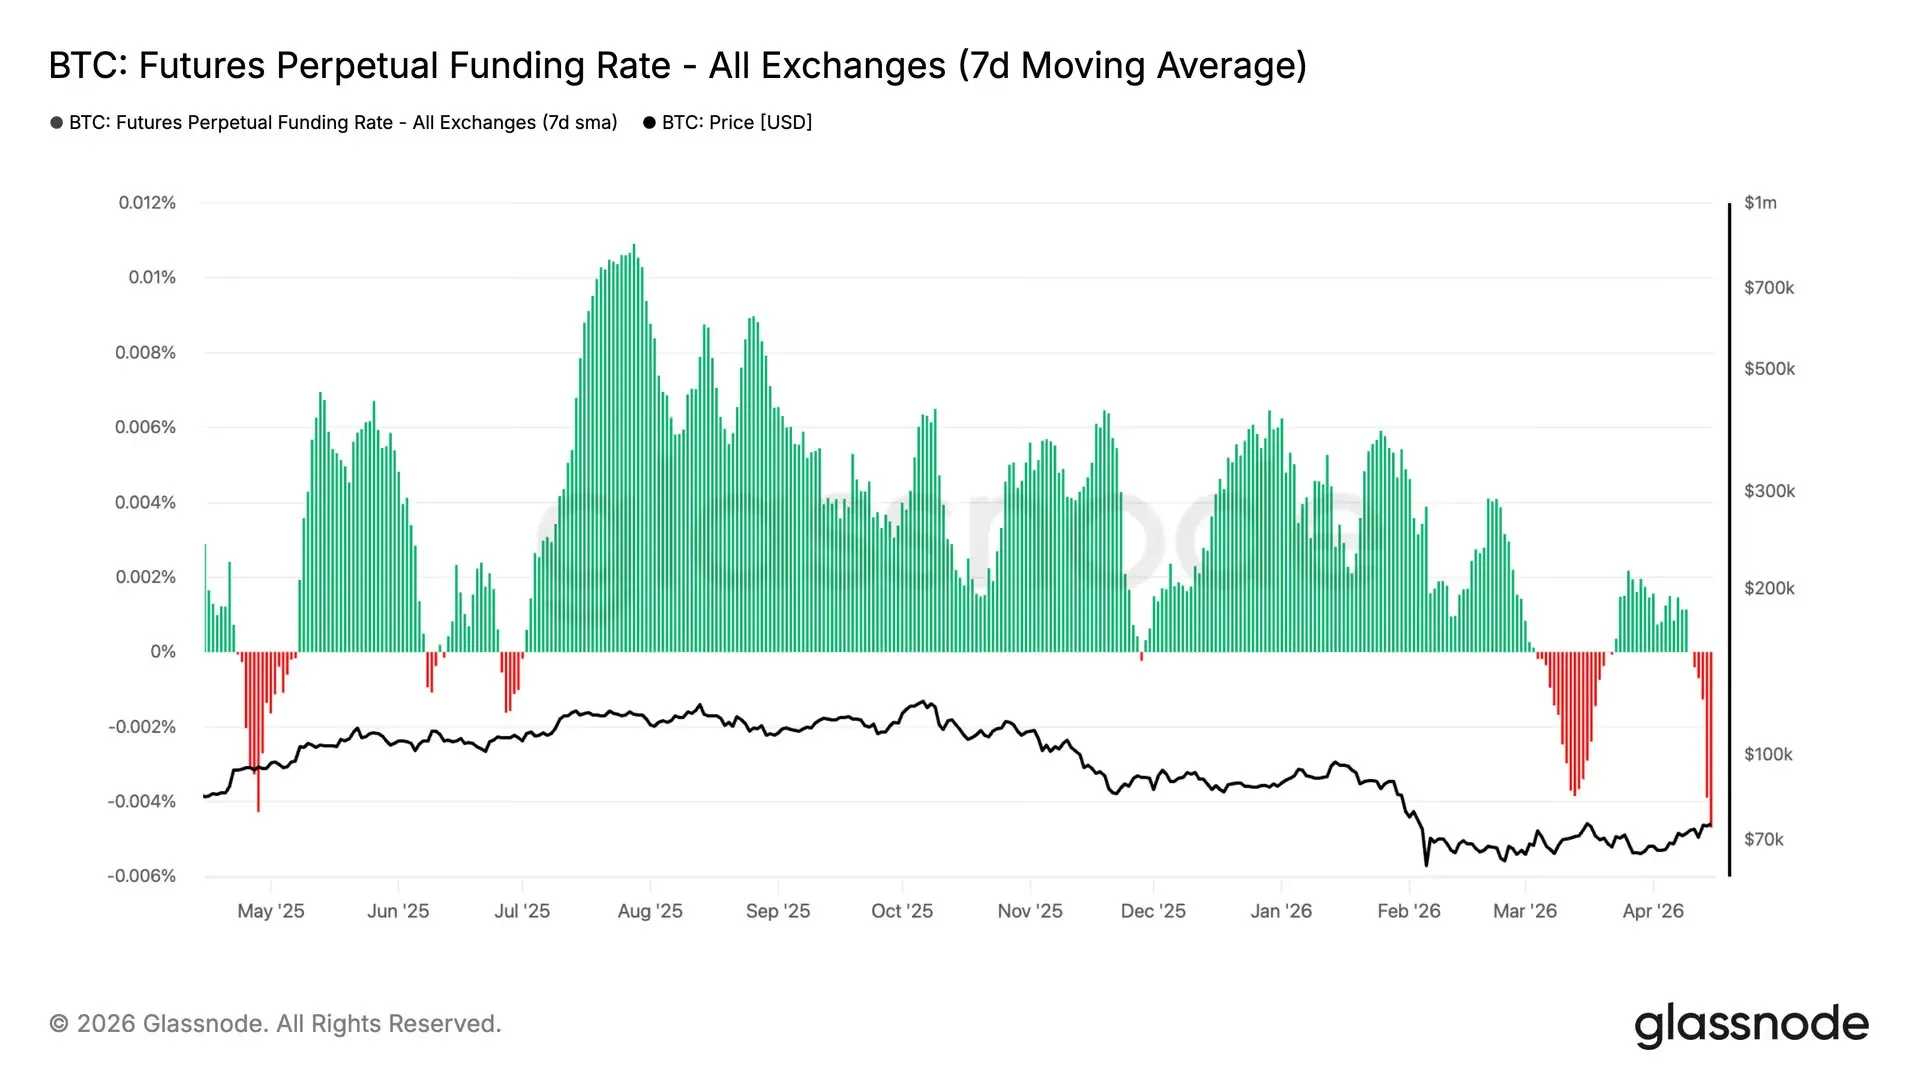
- Neutral funding: The global funding rate is at 0.0056. This indicates an absence of skew and directional leverage in the short term.
- Weak spot demand: The Coinbase Premium Index remains in negative territory, suggesting a local shortage of aggressive buying in the US spot market.
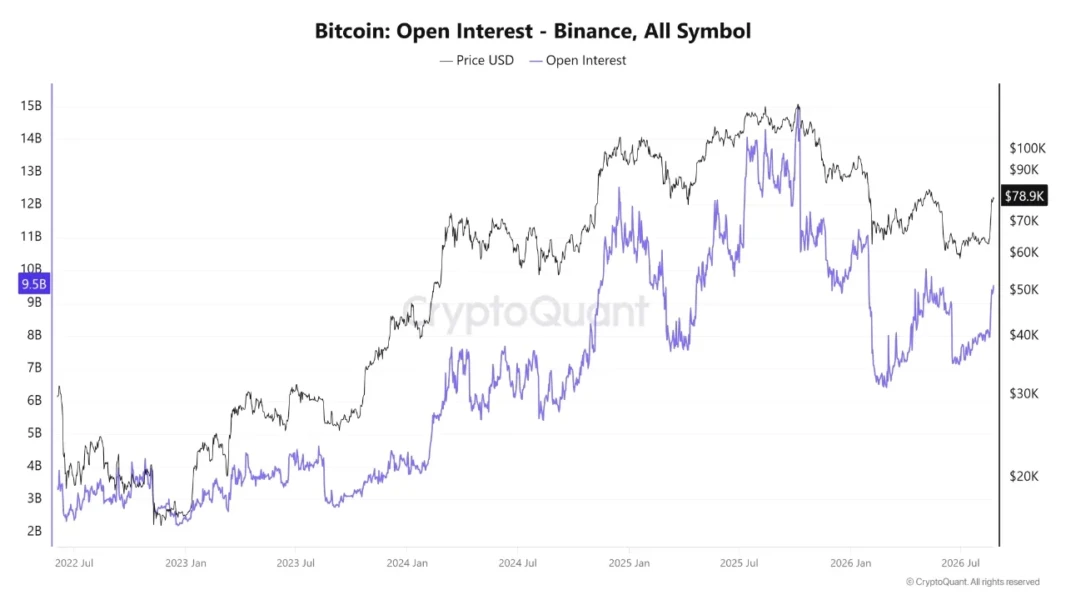
- Record open interest: According to Arab Chain, the volume of open interest for Bitcoin on the Binance exchange reached a three-month high of $9.54 billion.
Macroeconomic Background and “Liquidity Walls”
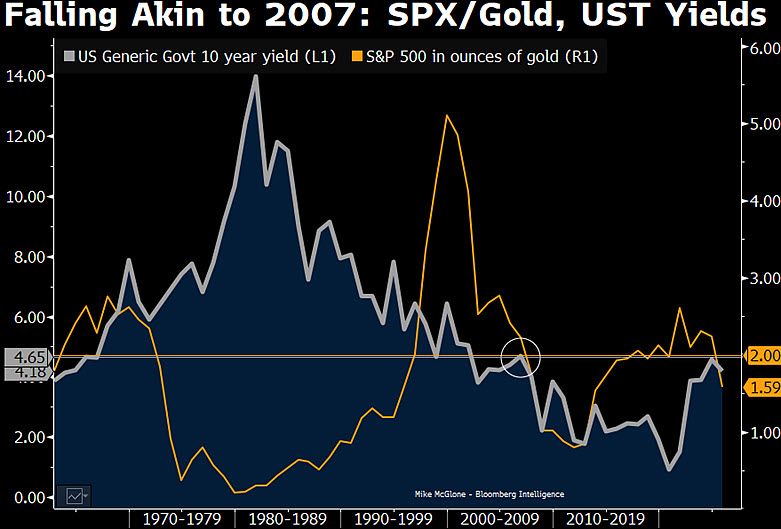
The decline in yields of 10-year US Treasury bonds traditionally increases the attractiveness of risk assets, including cryptocurrencies. However, the market is currently in a phase of “digesting” its local growth. Institutional investors are waiting for clearer signals from the US Federal Reserve.
An additional role is played by liquidity clusters:
- Resistance at $80,000–$82,000: A high concentration of limit sell orders (Ask Walls) and automated take-profits.
- Support at $72,000–$75,000: A large cluster of buy orders (Bid Walls) acting as a protective barrier for trading algorithms.
Key Scenarios for Future Developments
The current consolidation determines the asset’s trajectory for the coming weeks. Experts highlight two main directions:
- Bullish breakout: Sustained clearance of the $80,000 mark, supported by continued ETF inflows and spot demand, opens the path to the target block of $88,000 – $90,000.
- Deepening correction: The loss of support at $75,000 could sharply worsen the profitability balance of short-term holders. This could trigger panic selling and a deeper drawdown.
Summary for Investors
For long-term HODLers, the current situation is no cause for concern: the market is far from a state of macro-overheating. The pause looks like a healthy removal of local overbought conditions.
However, futures traders should exercise maximum caution: a record open interest of nearly $10 billion combined with neutral funding creates ideal conditions for impulse squeezes in both directions. Any sharp price movement will trigger a cascade of marginal position liquidations.