February 2026 has proven to be a truly “red” month for the crypto market. On February 24, the flagship cryptocurrency hit a local low, dipping to $62,800. Despite a weak recovery attempt toward $63,100, the overall market environment remains extremely tense.
Current Market Status
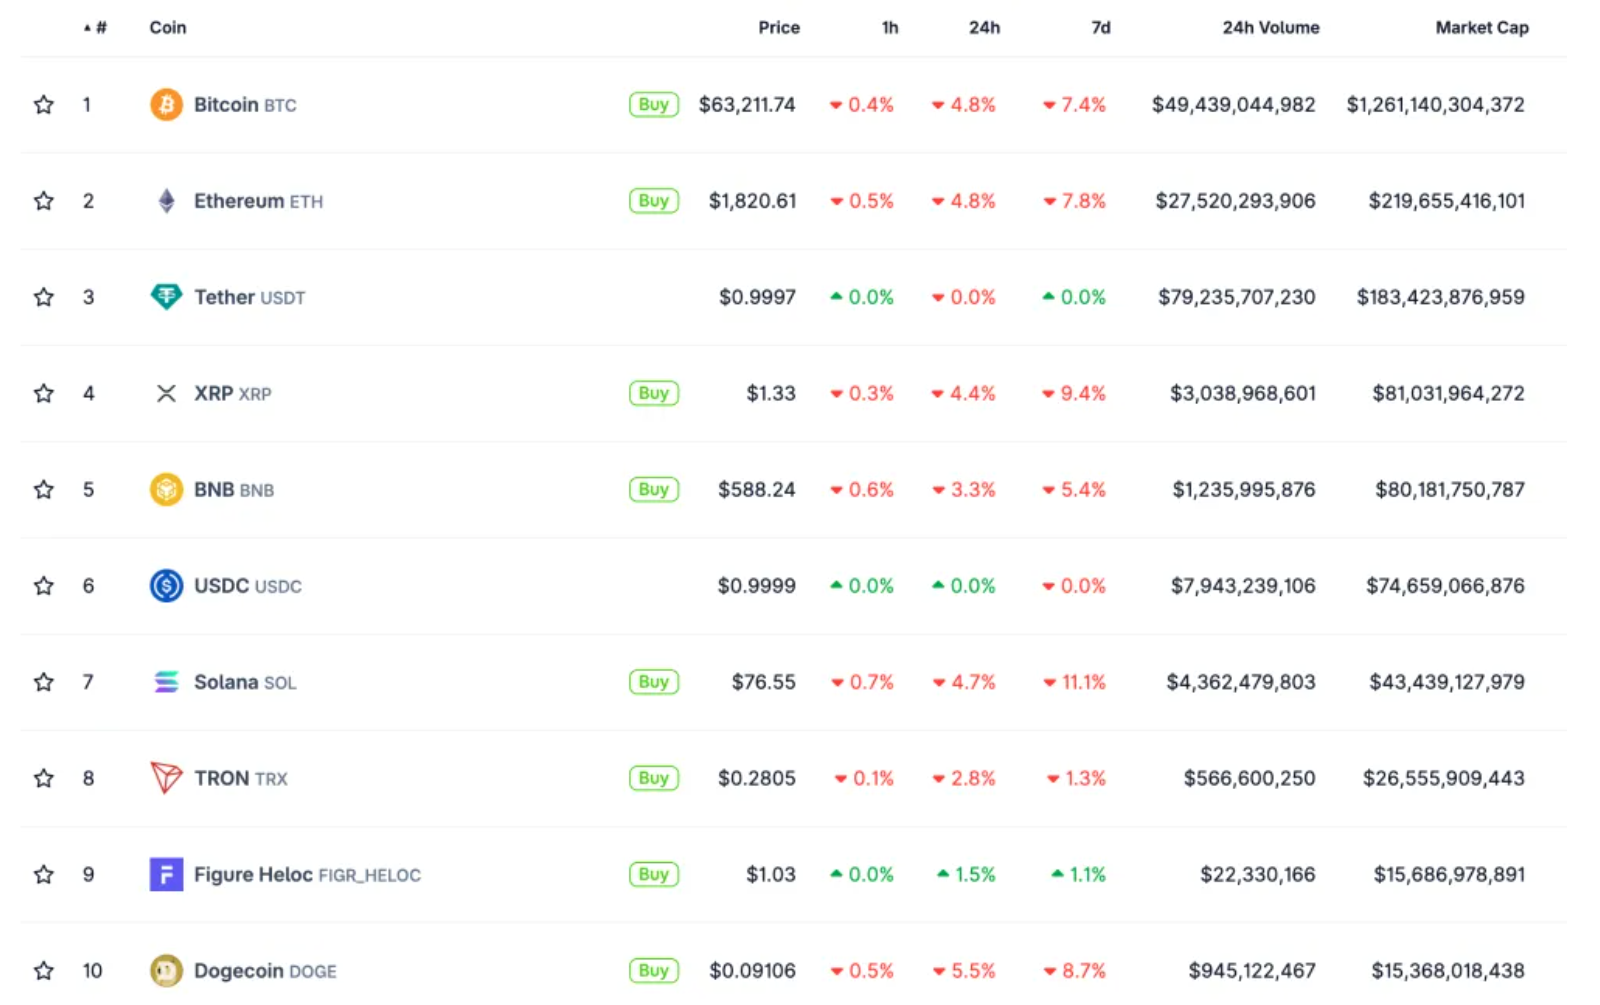
The market is currently gripped by panic, as evidenced by the data:
- Ethereum: Lost 4.8%, trading around the $1,800 mark.
- Total Sector Cap: Dropped by 4% to $2.2 trillion.
- Fear & Greed Index: Plummeted to 8 points, signaling a zone of “Extreme Fear.”
Fundamental Pressure: Geopolitics and Tariffs
Analysts identify geopolitical instability as the primary driver behind this correction. News regarding potential U.S. trade tariff hikes is putting significant pressure on risk assets.
“The macroeconomic backdrop is forcing investors to avoid risk. In this environment, digital assets are often the first to suffer,” noted Min Jung, a researcher at Presto Research.
Notably, the crypto market is declining more aggressively than traditional risk assets. This divergence points to internal friction: low liquidity and a prolonged capital flight from spot ETFs, which have now recorded their fifth consecutive week of outflows.
Technical Outlook: The Line in the Sand
Andri Fauzan Adziima, Head of Research at Bitrue, identifies the $60,000–$63,000 range as a critical support zone. The fate of the current cycle depends on whether this level holds.
Potential Scenarios:
| Scenario | Price Levels | Trigger |
| Optimistic | Holding above $60,000 | Return of ETF inflows, improved macro-background. Potential Short Squeeze. |
| Pessimistic | Drop to $50,000 – $55,000 | Breach of $60,000 triggering cascading long liquidations. |
| Capitulation | Slump to $47,000 | Mass sell-off by long-term holders (HODLers) amid deteriorating sentiment. |
Deleveraging: Why This Might Not Be the End
Despite the daunting figures, experts view the current movement as a “healthy” market reset. This decline is primarily driven by deleveraging (the reduction of debt-fueled positions).
Three key indicators confirm this:
- Negative funding rates (futures trading at a discount to spot).
- A sharp drop in Open Interest.
- Cascading long liquidations totaling hundreds of millions of dollars.
The Silver Lining: as we mentioned earlier in the article – Long-term investors are not panicking yet. On-chain metrics suggest that “whales” and dedicated HODLers are using this dip for “quiet accumulation,” while short-term speculators realize their losses.