The cryptocurrency market has entered a period of significant cooling. According to recent data from the analytical platform CryptoQuant, the gap between Bitcoin’s spot price and its realized price has narrowed to 21%. For context, this figure stood at a staggering 120% at the end of 2024.
Despite this substantial correction, historical data suggests that the cyclical “bottom” may still be over the horizon.
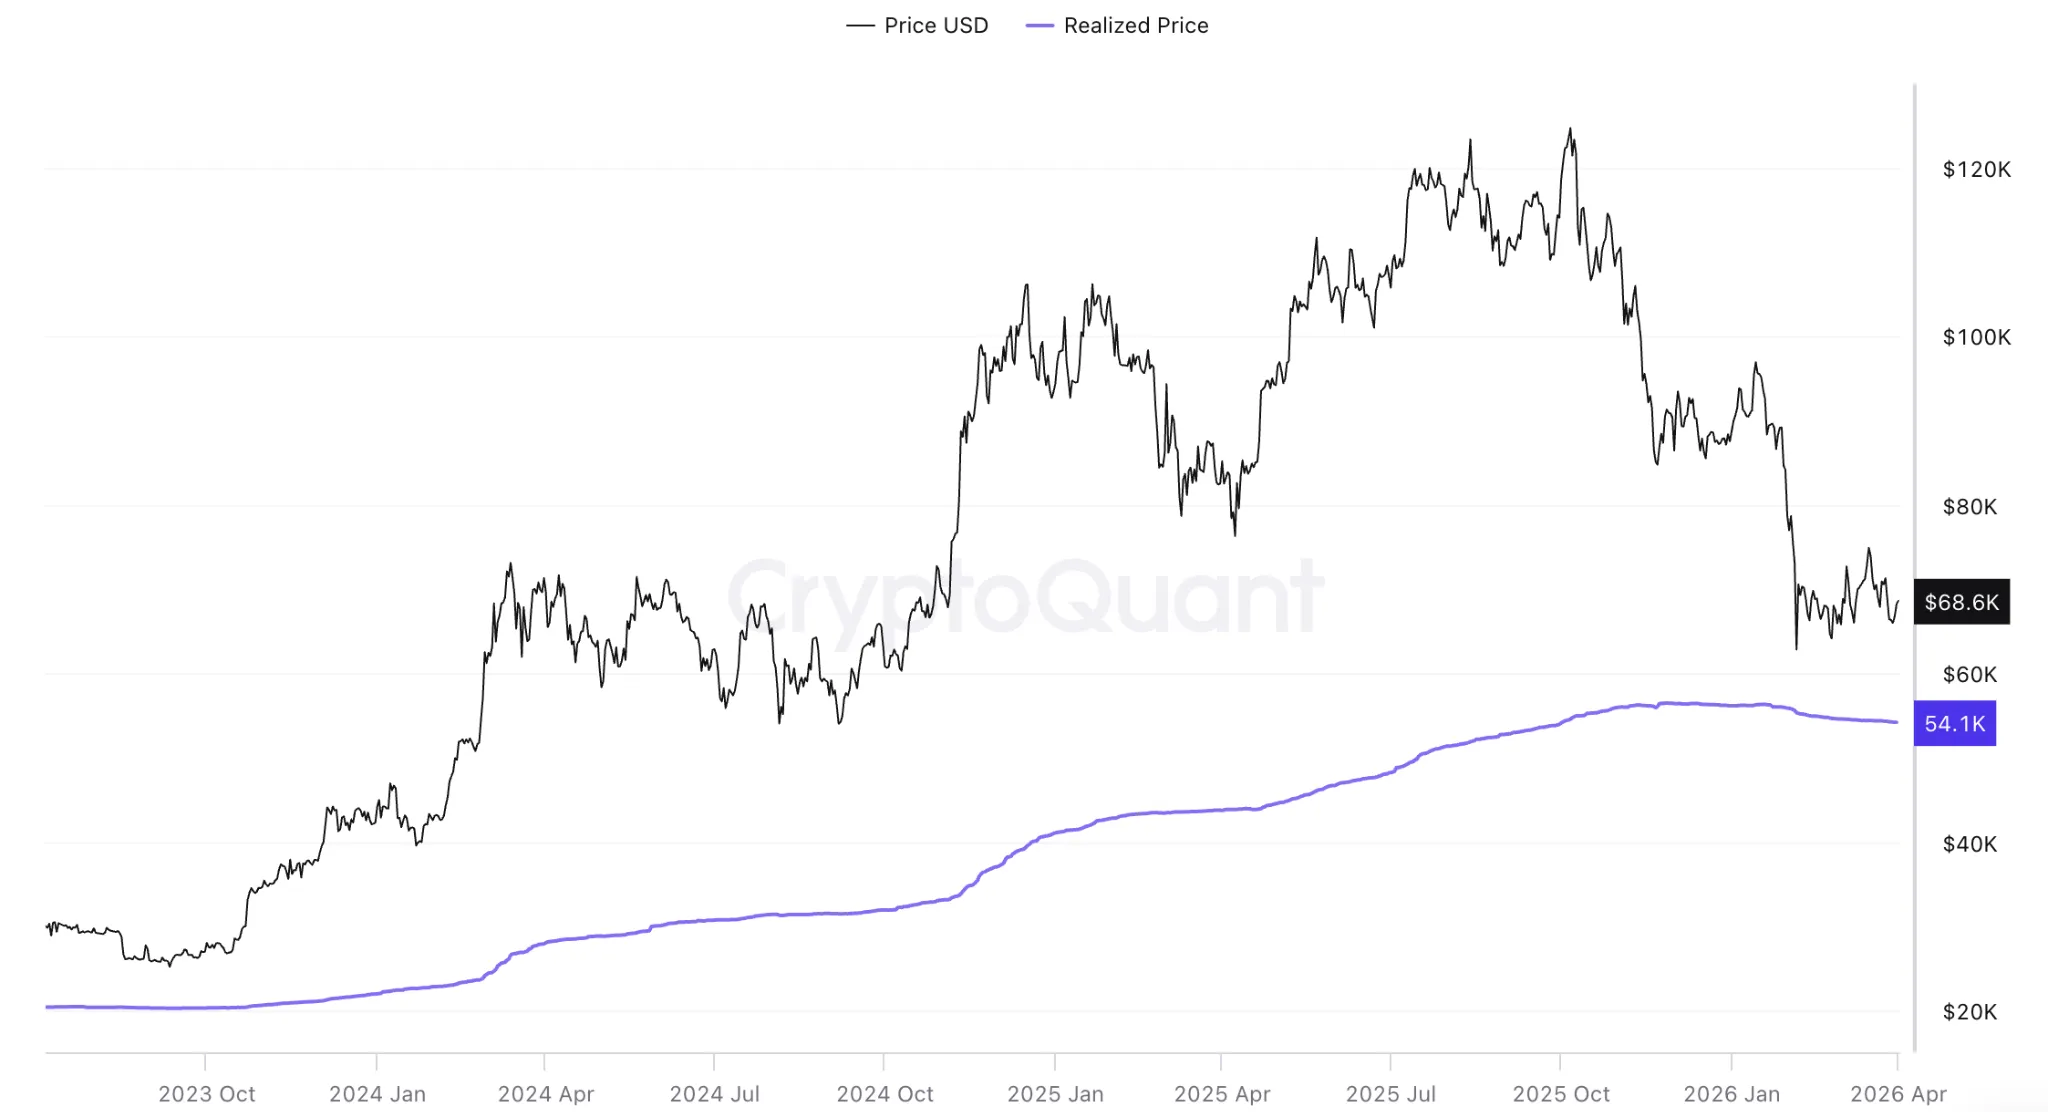
Realized Price as the Primary Anchor
The Realized Price is an on-chain metric representing the average cost basis of all coins in the network, calculated based on the price at the time they were last moved. Essentially, it reflects the “average entry price” for all market participants.
Currently, this metric sits at approximately $54,100.
Lessons from Past Cycles
History shows that a true cyclical bottom typically forms only when the market price dips below the realized price:
- The 2022 Bear Market: From June to October, Bitcoin traded below its average cost basis. The bottom was hit at $15,500, when the spot price fell 15% below the realized price.
- March 2020: A brief crossover occurred during the panic sell-off triggered by the COVID-19 pandemic.
Why the Correction Might Continue
Today’s 20% premium over the realized price indicates that the majority of Bitcoin holders are still in profit. This creates a “cushion” that could allow for further selling pressure. For the asset to enter the historical accumulation zone (below the average cost basis), quotes would need to slide at least another 20% from current levels—down toward the $54,000 mark.
Concerning On-Chain Signals
Beyond price metrics, several other factors suggest the correction is not yet over:
- Institutional Cooling: The Coinbase Premium Index remains in negative territory. This indicates that major U.S. investors have either paused their buying or are actively taking profits.
- ETF Outflows: According to Glassnode, the 7-day moving average (SMA) of net flows into U.S. spot Bitcoin ETFs has turned negative. Funds are seeing daily outflows ranging from 200 to 500 BTC.
- Low Network Activity: Daily transaction fees in the network have plummeted to 2.5 BTC—the lowest level since March 2011.
Summary
The declining demand for block space and the capital flight from ETFs confirm the thesis of low user activity. Until the spot price tests the realized value level around $54,000, it may be premature to claim that the correction has ended or that a solid foundation for a new rally has been formed.