A fresh escalation in the Middle East has instantly rattled financial markets. On July 8, the price of the premier cryptocurrency briefly dipped to $61,700. The sell-off was triggered by statements from US President Donald Trump, who declared the truce effectively over following a new wave of mutual military strikes, SkyNews reports.
How Markets Reacted: Crypto, Stocks, and Oil
Over the past 24 hours, the crypto market flagship has slid by 2% and is currently hovering around $62,100 at the time of writing. The downward wave impacted major altcoins as well as the US traditional equity sector, while safe-haven and commodity assets ticked upward.
| Asset | Current Price / Value | 24-Hour Change |
| Bitcoin (BTC) | ~$62,100 | ↓ 2% |
| Ethereum (ETH) | ~$1,700 | ↓ 2.4% |
| XRP | $1.08 | ↓ 4.2% |
| Solana (SOL) | $77.24 | ↓ 5% |
| Nasdaq 100 & S&P 500 Futures | — | ↓ 1–1.5% |
| WTI Crude Oil | $74.02 per barrel | ↑ over 5% |
Note: Amid the drop in risk assets, the US Dollar Index (DXY) demonstrated stability, holding firmly above the 100 mark.
Conflict Timeline: Why Did the Truce Fail?
The escalation peaked on the night of July 8, when the US Central Command struck over 80 military targets inside Iran, including radar stations and air defense systems. This action was a retaliation for an attack by Iranian forces on Qatari and Saudi commercial tankers in the Strait of Hormuz on July 7.
In response, the Islamic Revolutionary Guard Corps (IRGC) claimed strikes on 85 targets at US bases in Kuwait and Bahrain, emphasizing that they would not relinquish control over the strait.
Brief timeline of the agreement:
- February 28: Outbreak of open confrontation between the countries.
- April 8: The first ceasefire agreement brokered by Pakistan.
- June 17: Signing of the “Islamabad Memorandum,” which extended the truce for 60 days to negotiate a final agreement.
Although Donald Trump stated that the truce is “over” (Washington has already rolled back oil sanctions relief for Tehran), diplomatic channels remain open. Formally, neither side has announced a complete withdrawal from the memorandum.
Where Will Bitcoin Go Next? Key Levels for Traders
As the market processes the geopolitical news, analysts are focusing on the technical picture and on-chain metrics.
- Daan Crypto Trades notes that for bulls to regain confidence, BTC needs to break above $67,300—this would be the ultimate sign of strength. He identified $62,800 as an important level acting as the 200-week SMA, while the $60,700 area serves as critical support. The lower boundary of the current range sits at $59,860.
- Michaël van de Poppe (founder of MN Trading) remains more optimistic. In his view, the $61,000 mark is crucial for the current market structure. As long as this level holds, the scenario of a rally toward $68,000 remains the priority, making the current dip just an acceptable, shallow correction.
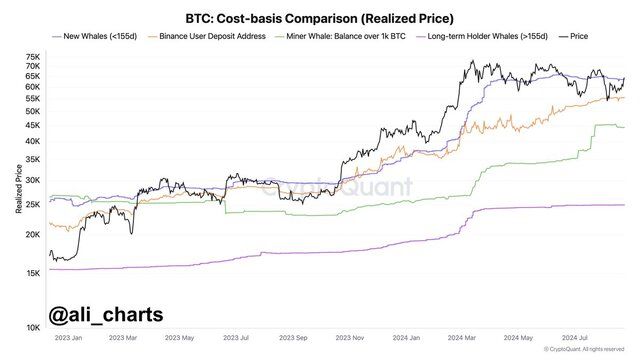
- CryptoQuant analysts warn of underlying risks. According to their data, BTC’s recent pump to $64,000 was purely speculative: open interest is rising due to aggressive long positions from retail traders, while spot volumes are actually falling. An expert under the pseudonym TheChessOnChain believes a drop below $58,000 is highly probable.
Long-Term Outlook
Despite the localized turbulence caused by geopolitics, major institutional players maintain a bullish macro outlook. Specifically, analysts at Bernstein reaffirmed their forecast, stating that the target of $150,000 per Bitcoin remains fully achievable by the end of 2026.