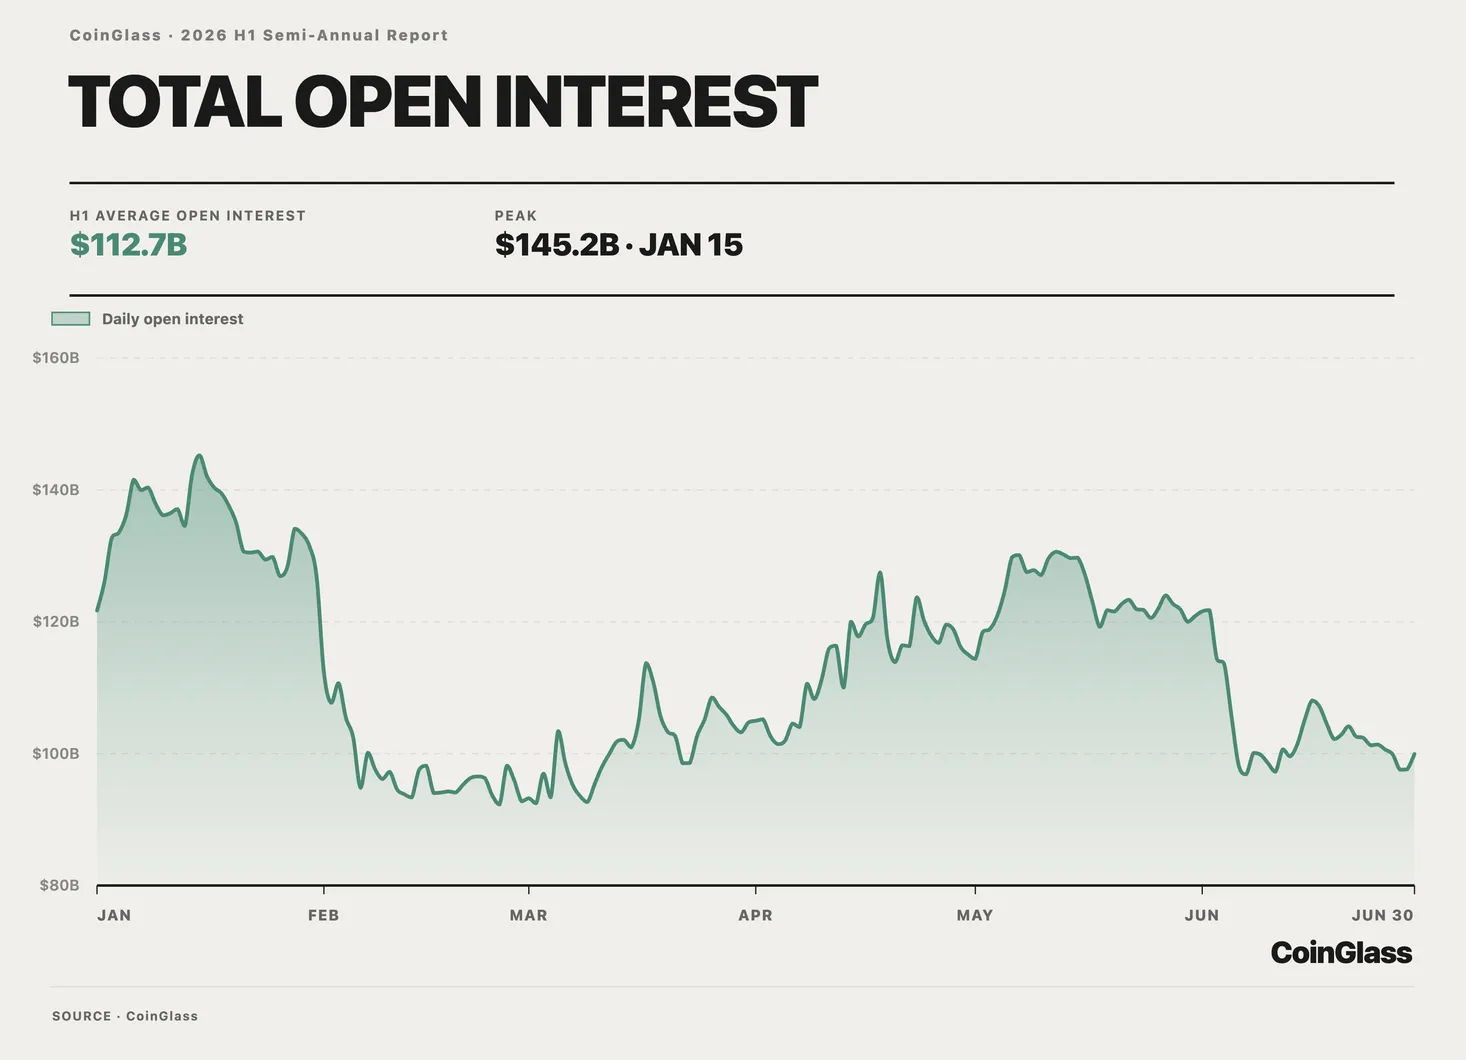
The cryptocurrency derivatives market experienced a tangible cooling in activity during the first half of 2026. According to a report by analytics platform CoinGlass, total trading volume dropped by nearly 16% compared to the same period last year, yet systemic risks remain present. The defining feature of the past six months was an asynchronous recovery: while trading volumes declined, open interest remained at elevated levels, increasing the market’s sensitivity to price shocks.
Volume Dynamics: Decline from January Highs
Over the first six months of 2026, total crypto derivatives trading volume reached $35.08 trillion, down 15.7% from H1 2025 ($41.60 trillion). Average daily turnover stood at $193.8 billion.
The decline in trading activity was protracted, hitting a local bottom in mid-spring:
- January: $6.73 trillion
- February: $6.25 trillion
- March: $5.83 trillion
- April: $5.29 trillion (half-year low)
- May: $5.31 trillion
- June: $5.66 trillion
In Q2, total turnover fell by 13.5% compared to Q1 (down to $16.27 trillion). Analysts highlighted the event-driven nature of trading activity: peak daily volume was recorded on February 6 ($480.4 billion), while the minimum occurred on April 5 ($74.7 billion)—a 6.4x spread between the peak and trough.
The June rebound does not yet indicate a sustainable trend reversal, as trading volume at the end of the half-year remained 15.9% below January levels.
Disconnect Between Volumes and Open Interest
Average daily open interest (OI) for the half-year was $112.7 billion (-10% year-over-year), and by June 30, total OI dropped to $99.94 billion (-17.9% year-to-date).
However, experts noted a dangerous divergence in Q2:
- Total trading volume fell 13.5% quarter-over-quarter.
- Average daily open interest actually rose by 2.1%.
Traders did not close their positions at the same pace market activity was cooling down. The accumulation of unhedged exposure in a declining liquidity environment creates conditions where even minor price moves can trigger cascades of forced liquidations.
Waves of Liquidations: Bulls Took the Main Blow
During the first half of the year, CoinGlass tracked liquidations totaling $73.35 billion across monitored exchanges (averaging roughly $405 million per day).
The majority of forced closures hit long positions:
- Long positions: $45.63 billion (62.2%)
- Short positions: $27.72 billion (37.8%)
The peak of liquidations was recorded in June at $16.14 billion, with longs accounting for 69.5%. The single heaviest day was January 31, when the market saw $2.588 billion wiped out in 24 hours ($2.433 billion in longs). Notably, just three volatile days accounted for 8.9% of all liquidations during the six-month period.
Exchange Dominance and Liquidity Structure
Market concentration in crypto derivatives continues to rise. The top 10 exchanges accounted for 81.2% of total trading volume (reaching 82.3% in June), while the top 5 held 61.2% of the market.
| Exchange | Trading Volume Share | Open Interest (OI) Share |
| Binance | 26.6% ($9.34T) | 21.3% ($24.01B) |
| OKX | 11.9% ($4.19T) | 6.0% ($6.70B) |
| Bybit | 7.7% ($2.72T) | — |
| MEXC | 7.7% ($2.70T) | 7.9% ($8.93B) |
| Gate | 7.2% ($2.53T) | 9.1% ($10.23B) |
| Bitget | 4.8% ($1.68T) | 5.7% ($6.39B) |
| CME | 4.1% ($1.43T) | 12.0% ($13.55B) |
The market structure clearly illustrates the divide between retail and institutional trading. The Chicago Mercantile Exchange (CME) ranked only 7th in trading volume, but jumped to 2nd place in open interest (12%). This highlights institutional preference for holding positions longer-term, contrasting with the high-velocity speculative trading on crypto-native platforms.
Order Book Depth (±1% of Price)
- BTC Derivatives: Combined order book depth across the top 5 platforms stood at $537 million. The market is highly concentrated, with Binance providing 44% of the depth ($236 million) and OKX adding another 20.8% ($112 million).
- ETH Derivatives: Total depth reached $381 million. Liquidity was more evenly distributed: Binance held 28.7% ($109 million), Bitget 21.4% ($81.37 million), and OKX 19.2% ($73.35 million).
Outflows in Spot ETFs
The institutional sector via US spot exchange-traded funds also reflected market caution:
- Spot Bitcoin ETFs: Closed the first half of the year with a net outflow of $5.46 billion. Capital inflows in March (+$1.32 billion) and April (+$1.97 billion) were insufficient to offset heavy redemptions in May (-$2.43 billion) and June (-$4.51 billion).
- Spot Ethereum ETFs: Recorded a net outflow of $1.483 billion. Total assets under management (AUM) for ETH funds plummeted from $19.05 billion on January 2 to $8.33 billion on June 30.
The past half-year showed that the leverage unwinding process in the crypto market is far from complete. In the second half of 2026, the key determining factor will be the market’s ability to attract fresh institutional inflows and rebuild order book depth. For now, K33 analysts warn of a potential lull ahead, projecting that spot trading activity in July could hit its lowest levels since late 2023.